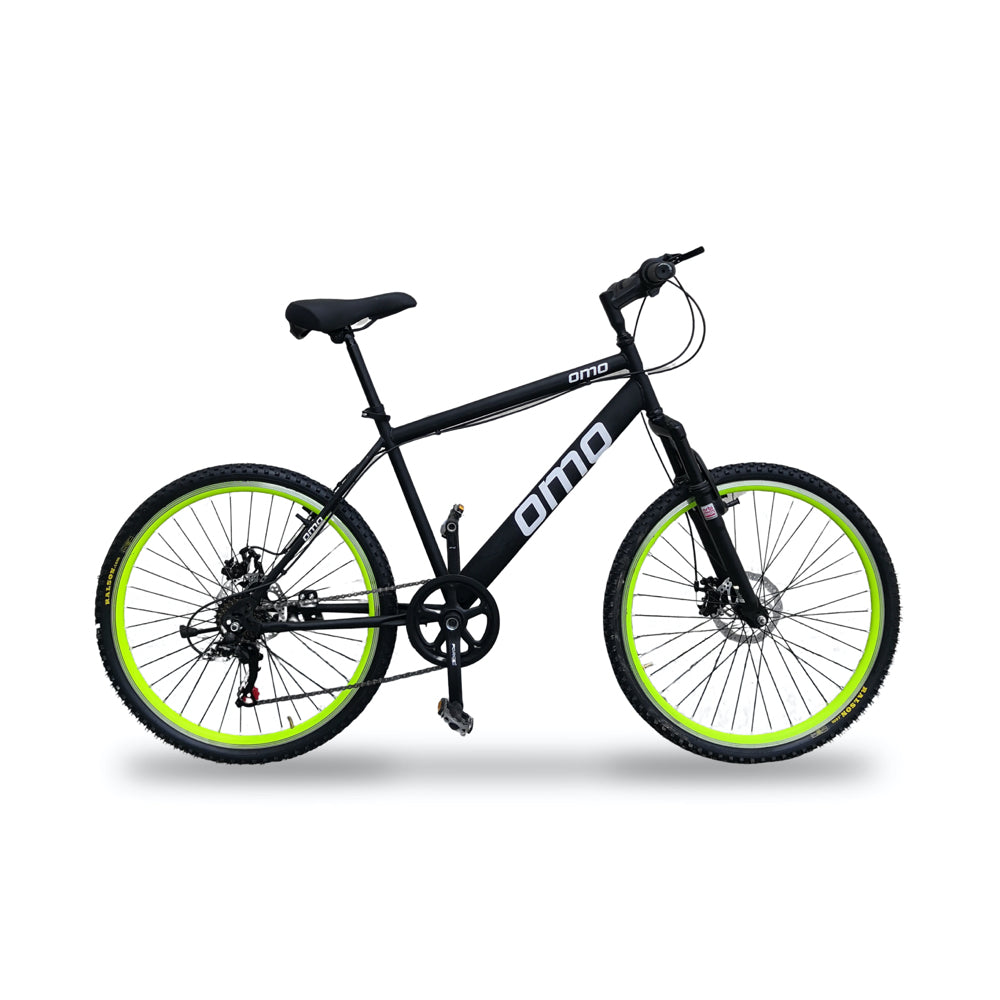
World's First Carbon Negative Ebike : OMO Bikes
OMO BikesShare
In our previous posts, we wrote about how OMO electric cycles are revolutionizing daily commute to be environment friendly with negative CO2 emission.
That was half the part as it accounted for electricity used for charging is through coal burning. Continuing the other half of that story, in this post we will discuss in detail the carbon produced in manufacturing of OMO electric cycles.

Manufacturing and maintenance of Non Electric parts of cycle The average OMO cycle uses around ~16 kg steel, ~1.5 kg rubber, ~2 kg aluminium.
Using these assumptions, it is estimated that bicycle production and maintenance
(like tyre replacement, and lubrication) accounts for approximately 5 grams CO2 /km emission.
Manufacturing and Maintenance of Electrical parts on E-BIkes
Lithium Ion Battery :- Carbon emission for manufacturing a 481 kWh Lithium Ion battery = 53,000 gram GHG With a life of ~15000 km it makes battery production CO2 per km of ride is 3.5 gram /km Motor :- We don't have exact data and source of carbon emission of electric motor, but accounting the material used in manufacturing the carbon emission in manufacturing electric motor with average life of 3 year is 50,000 gram
Considering the average yearly commute to be 3000 km, the per km carbon emission is 5.5 gram/km
That being said the total amount of carbon emission per km of running electric cycle is
( Cycle manufacturing + lithium battery manufacturing + Manufacturing of Motor)
(5 gram/km + 3.5 gram/km + 5.5 gram/km) = 14 gram/km
We Haven't Finished Yet. There's More.
As we wrote in previous post, the carbon emission while running the bike on battery power is 9.5 gram/km
Let's see the CO2 emissions when you are doing riding the electric cycle on pedal assist mode.
When you cycle with pedalling, do exercise using Ebike to become healthy , you burn 300 calories in 45 minutes at a speed of 10-15km/hr for a ride of 10 km.

This calories comes from the extra intake of your daily food which comes around to an increase of around 50% in daily food intake.
When all calculated, the CO2 emission for pedal assist comes nearly same as electric CO2 envision of 5 gram/km. So,
Per km CO2 emission using only electric power is = 14 + 9.5 = 23.5gram/km
Per km CO2 emmision using pedal assist = 14 + 5 = 21gram/km
Now, as you know, we plant 5 trees for every bike sold, and make sure at least 80% of plants survive to grow into healthy trees. A Young plant's (1 year old) CO2 consumption is around 5,900 gram/ year
Hence, after 2 years
the 5 trees we plant consume = 29,000 gram/ year = 9.6 gram/km(assuming 3000km run yearly)
After 10 years these plant consume 27,000 gram each plant per year making total consumption of 85,000 gram/ year =(28.5 gram/km)

This makes your daily commute produce more oxygen than carbon. this means, that OMO riders who opted for most economic mode of commute are actually make our planet greener by riding more. The more you ride, the greener it gets. And that's why we say, ride more.
Our previous story about How OMO Bikes are making India carbon negative one bike at a time
The above calculations are based on estimations as found during our research on the web. We are performing an actual institute level research on this. Let us know, if you want to be a part of it.

